
Page 459 - niengiam2022
P. 459
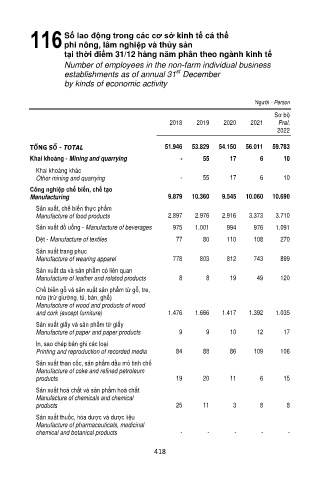
Số lao động trong các cơ sở kinh tế cá thể
          116
                   phi nông, lâm nghiệp và thủy sản
                   tại thời điểm 31/12 hàng năm phân theo ngành kinh tế
                   Number of employees in the non-farm individual business
                                                   st
                   establishments as of annual 31  December
                   by kinds of economic activity


                                                                         Người - Person
                                                                               Sơ bộ
                                                 2018    2019   2020    2021    Prel.
                                                                                2022

          TỔNG SỐ - TOTAL                       51.946   53.829   54.150   56.011   59.783
          Khai khoáng - Mining and quarrying        -      55     17       6     10

           Khai khoáng khác
           Other mining and quarrying               -      55     17       6     10
          Công nghiệp chế biến, chế tạo
          Manufacturing                          9.879   10.360   9.545   10.060   10.690
           Sản xuất, chế biến thực phẩm
           Manufacture of food products          2.897   2.976   2.916   3.373   3.710
           Sản xuất đồ uống - Manufacture of beverages   975   1.001   994   976   1.091
           Dệt - Manufacture of textiles           77      80    110     108     270
           Sản xuất trang phục
           Manufacture of wearing apparel         778     803    812     743     899
           Sản xuất da và sản phẩm có liên quan
           Manufacture of leather and related products   8   8    19      49     120
           Chế biến gỗ và sản xuất sản phẩm từ gỗ, tre,
           nứa (trừ giường, tủ, bàn, ghế)
           Manufacture of wood and products of wood
           and cork (except furniture)           1.476   1.666   1.417   1.392   1.035
           Sản xuất giấy và sản phẩm từ giấy
           Manufacture of paper and paper products   9      9     10      12     17
           In, sao chép bản ghi các loại
           Printing and reproduction of recorded media   84   88   86    109     106
           Sản xuất than cốc, sản phẩm dầu mỏ tinh chế
           Manufacture of coke and refined petroleum
           products                                19      20     11       6     15
           Sản xuất hoá chất và sản phẩm hoá chất
           Manufacture of chemicals and chemical
           products                                25      11      3       8      8
           Sản xuất thuốc, hóa dược và dược liệu
           Manufacture of pharmaceuticals, medicinal
           chemical and botanical products          -       -      -       -       -

                                             418