
Page 466 - niengiam2022
P. 466
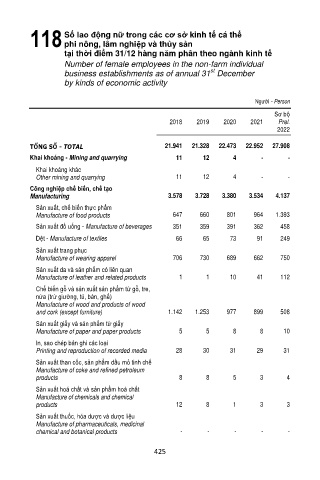
118
                   Số lao động nữ trong các cơ sở kinh tế cá thể
                   phi nông, lâm nghiệp và thủy sản
                   tại thời điểm 31/12 hàng năm phân theo ngành kinh tế
                   Number of female employees in the non-farm individual
                                                             st
                   business establishments as of annual 31  December
                   by kinds of economic activity

                                                                         Người - Person

                                                                               Sơ bộ
                                                 2018    2019   2020    2021    Prel.
                                                                                2022

          TỔNG SỐ - TOTAL                       21.941   21.328   22.473   22.952   27.908
          Khai khoáng - Mining and quarrying       11      12      4       -       -
           Khai khoáng khác
           Other mining and quarrying              11      12      4       -       -
          Công nghiệp chế biến, chế tạo
          Manufacturing                          3.578   3.728   3.380   3.534   4.137
           Sản xuất, chế biến thực phẩm
           Manufacture of food products           647     660    801     964   1.393
           Sản xuất đồ uống - Manufacture of beverages   351   359   391   362   458
           Dệt - Manufacture of textiles           66      65     73      91     249
           Sản xuất trang phục
           Manufacture of wearing apparel         706     730    689     662     750
           Sản xuất da và sản phẩm có liên quan
           Manufacture of leather and related products   1   1    10      41     112
           Chế biến gỗ và sản xuất sản phẩm từ gỗ, tre,
           nứa (trừ giường, tủ, bàn, ghế)
           Manufacture of wood and products of wood
           and cork (except furniture)           1.142   1.253   977     899     508
           Sản xuất giấy và sản phẩm từ giấy
           Manufacture of paper and paper products   5      5      8       8     10
           In, sao chép bản ghi các loại
           Printing and reproduction of recorded media   28   30   31     29     31
           Sản xuất than cốc, sản phẩm dầu mỏ tinh chế
           Manufacture of coke and refined petroleum
           products                                 8       8      5       3      4
           Sản xuất hoá chất và sản phẩm hoá chất
           Manufacture of chemicals and chemical
           products                                12       8      1       3      3
           Sản xuất thuốc, hóa dược và dược liệu
           Manufacture of pharmaceuticals, medicinal
           chemical and botanical products          -       -      -       -       -

                                             425