
Page 285 - niengiam2022
P. 285
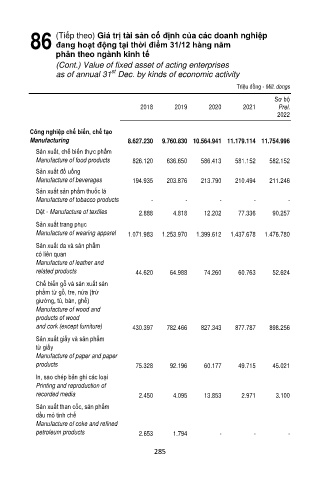
86      (Tiếp theo) Giá trị tài sản cố định của các doanh nghiệp
                 đang hoạt động tại thời điểm 31/12 hàng năm
                 phân theo ngành kinh tế
                 (Cont.) Value of fixed asset of acting enterprises
                                 st
                 as of annual 31  Dec. by kinds of economic activity
                                                                    Triệu đồng - Mill. dongs
                                                                               Sơ bộ
                                         2018      2019     2020      2021      Prel.

                                                                                2022

          Công nghiệp chế biến, chế tạo
          Manufacturing              8.627.230   9.760.830  10.564.941  11.179.114  11.754.996
           Sản xuất, chế biến thực phẩm
           Manufacture of food products   826.120   636.650   586.413   581.152   582.152
           Sản xuất đồ uống
           Manufacture of beverages    194.935   203.876   213.790   210.494   211.246
           Sản xuất sản phẩm thuốc lá
           Manufacture of tobacco products   -        -        -         -         -
           Dệt - Manufacture of textiles   2.888   4.818   12.202    77.336   90.257
           Sản xuất trang phục
           Manufacture of wearing apparel   1.071.983   1.253.970   1.399.612   1.437.678   1.476.780
           Sản xuất da và sản phẩm
           có liên quan
           Manufacture of leather and
           related products             44.620   64.988    74.260    60.763   52.624

           Chế biến gỗ và sản xuất sản
           phẩm từ gỗ, tre, nứa (trừ
           giường, tủ, bàn, ghế)
           Manufacture of wood and
           products of wood
           and cork (except furniture)   430.397   782.466   827.343   877.787   898.256
           Sản xuất giấy và sản phẩm
           từ giấy
           Manufacture of paper and paper
           products                     75.328   92.196    60.177    49.715   45.021
           In, sao chép bản ghi các loại
           Printing and reproduction of
           recorded media               2.450     4.095    13.853     2.971    3.100
           Sản xuất than cốc, sản phẩm
           dầu mỏ tinh chế
           Manufacture of coke and refined
           petroleum products           2.653     1.794        -         -         -

                                             285