
Page 271 - niengiam2022
P. 271
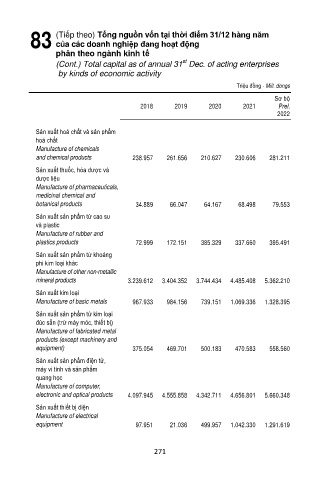
83      (Tiếp theo) Tổng nguồn vốn tại thời điểm 31/12 hàng năm
                 của các doanh nghiệp đang hoạt động
                 phân theo ngành kinh tế
                                                     st
                 (Cont.) Total capital as of annual 31  Dec. of acting enterprises
                  by kinds of economic activity

                                                                    Triệu đồng - Mill. dongs
                                                                               Sơ bộ
                                         2018      2019     2020      2021      Prel.

                                                                                2022

           Sản xuất hoá chất và sản phẩm
           hoá chất
           Manufacture of chemicals
           and chemical products       238.957   261.656   210.627   230.606   281.211

           Sản xuất thuốc, hóa dược và
           dược liệu
           Manufacture of pharmaceuticals,
           medicinal chemical and
           botanical products           34.889   66.047    64.167    68.498   79.553
           Sản xuất sản phẩm từ cao su
           và plastic
           Manufacture of rubber and
           plastics products            72.999   172.151   385.329   337.660   395.491
           Sản xuất sản phẩm từ khoáng
           phi kim loại khác
           Manufacture of other non-metallic
           mineral products          3.239.612   3.404.352   3.744.434   4.485.408   5.362.210
           Sản xuất kim loại
           Manufacture of basic metals   967.933   984.156   739.151   1.069.336   1.328.395
           Sản xuất sản phẩm từ kim loại
           đúc sẵn (trừ máy móc, thiết bị)
           Manufacture of fabricated metal
           products (except machinery and
           equipment)                  375.054   469.701   500.183   470.583   558.560
           Sản xuất sản phẩm điện tử,
           máy vi tính và sản phẩm
           quang học
           Manufacture of computer,
           electronic and optical products   4.097.945   4.555.858   4.342.711   4.656.801   5.660.348

           Sản xuất thiết bị điện
           Manufacture of electrical
           equipment                    97.951   21.036   499.957   1.042.330   1.291.619


                                             271